The Archery Handicap System
In this article I hope to explain the archery handicap system, look at where it comes from to provide a better understanding, and highlight some of the less-well-known uses of the scheme.
Introduction
Within archery there exists a handicap system that allows any quantity of arrows shot at any distance to be given a rating that reflects how good the performance was. This rating depends only on an archer’s accuracy i.e. their ability to shoot a tight group.
The archery handicap system is often ignored by archers, however, and when acknowledged is frequently only done so as “handicap…?, oh yes, my records officer gave me a number at the end of the season”. My belief is that the general disregard for the handicap system stems from a lack of understanding about its foundations, how it works, and, as a result, not realising its true potential.
Background
Archery in the UK has a rich history, from both a militaristic and recreational perspective. As a result there are a great variety of different rounds that can be shot under GNAS or ArcheryGB rules. For reasons I will explore later in more depth, it is interesting to know how a performance on a particular round on one day compares to that on a different round on another. This is the main idea behind handicaps.
The archery handicap tables were developed by David Lane for GNAS (now known as Archery GB) in 1978 and 1979. Since then they feature in the purchasable versions of the ArcheryGB rules of shooting and shooting administrative procedures. Further details are given in a series of papers by David Lane which are listed at the end of this article, with a PDF of the main document.
To try and understand this let us imagine that an archer of a certain skill level shoots an arrow. We can trace the path of the arrow from the archer to the target and see where it landed. This can be done for any size target at any distance. If we repeat this process many times we can build up an entire competition, and obtain a score for an archer of a particular level of skill.
The ‘skill level’ is what we will call the archer’s handicap. The lower the handicap, the better, and the tighter an archer’s groups. The higher the handicap, the less skilled the archer, and the more each arrow can be expected to deviate from being an x.
If you wish to calculate your handicap for any scores there is a handy web calculator that is free to use at archerycalculator.co.uk . I also recommend looking at their score management software as well if you or your club plan to get more involved with handicaps. Handicaps and classifications are calculated automatically from your scores which makes life a breeze.
Understanding the handicap system
Here I will attempt to explain the ideas behind the handicap system with minimal maths. My hope is that anyone can read this to gain a better appreciation of the system and how it works. For the more mathematically minded I hope to explore the finer details with far less hand-waving in a future article.
We start by considering the perfect archer.
Every arrow they shoot follows the exact same trajectory straight to the x.
This means that the arrow always leaves the bow in exactly the same way, at the same height, angle, and speed.
In real terms they have perfectly repeatable technique every shot, and can hold perfectly steady on the gold when aiming.
The perfect archer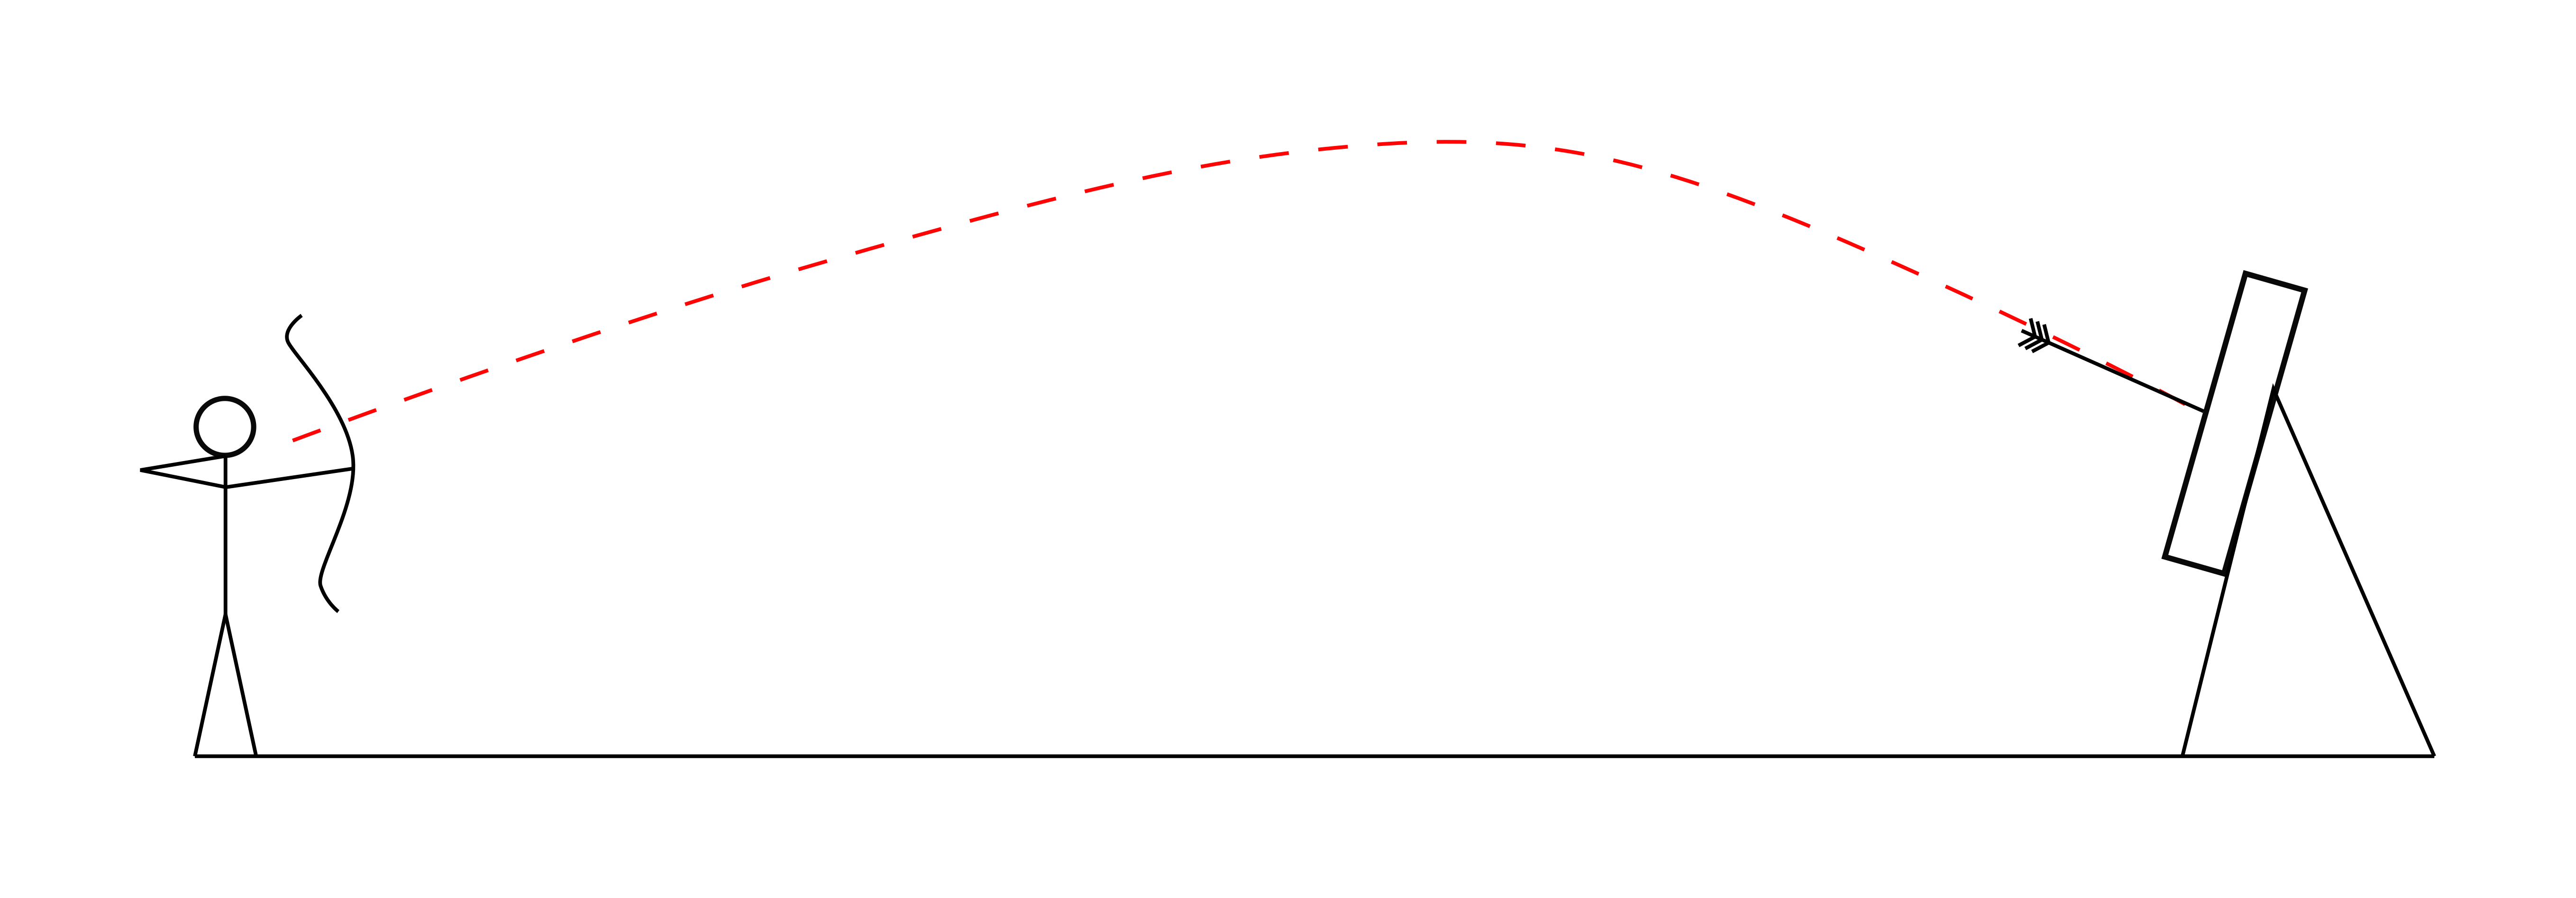
Now consider the reality.
There will be some slight variation in technique from shot to shot, and variation of the point of release as the sight floats during the aiming process.
As a result each arrow will follow a slightly different path to the target, spread around the perfect trajectory illustrated above.
This is illustrated below where the archer is still shooting a good group, but with some variation.
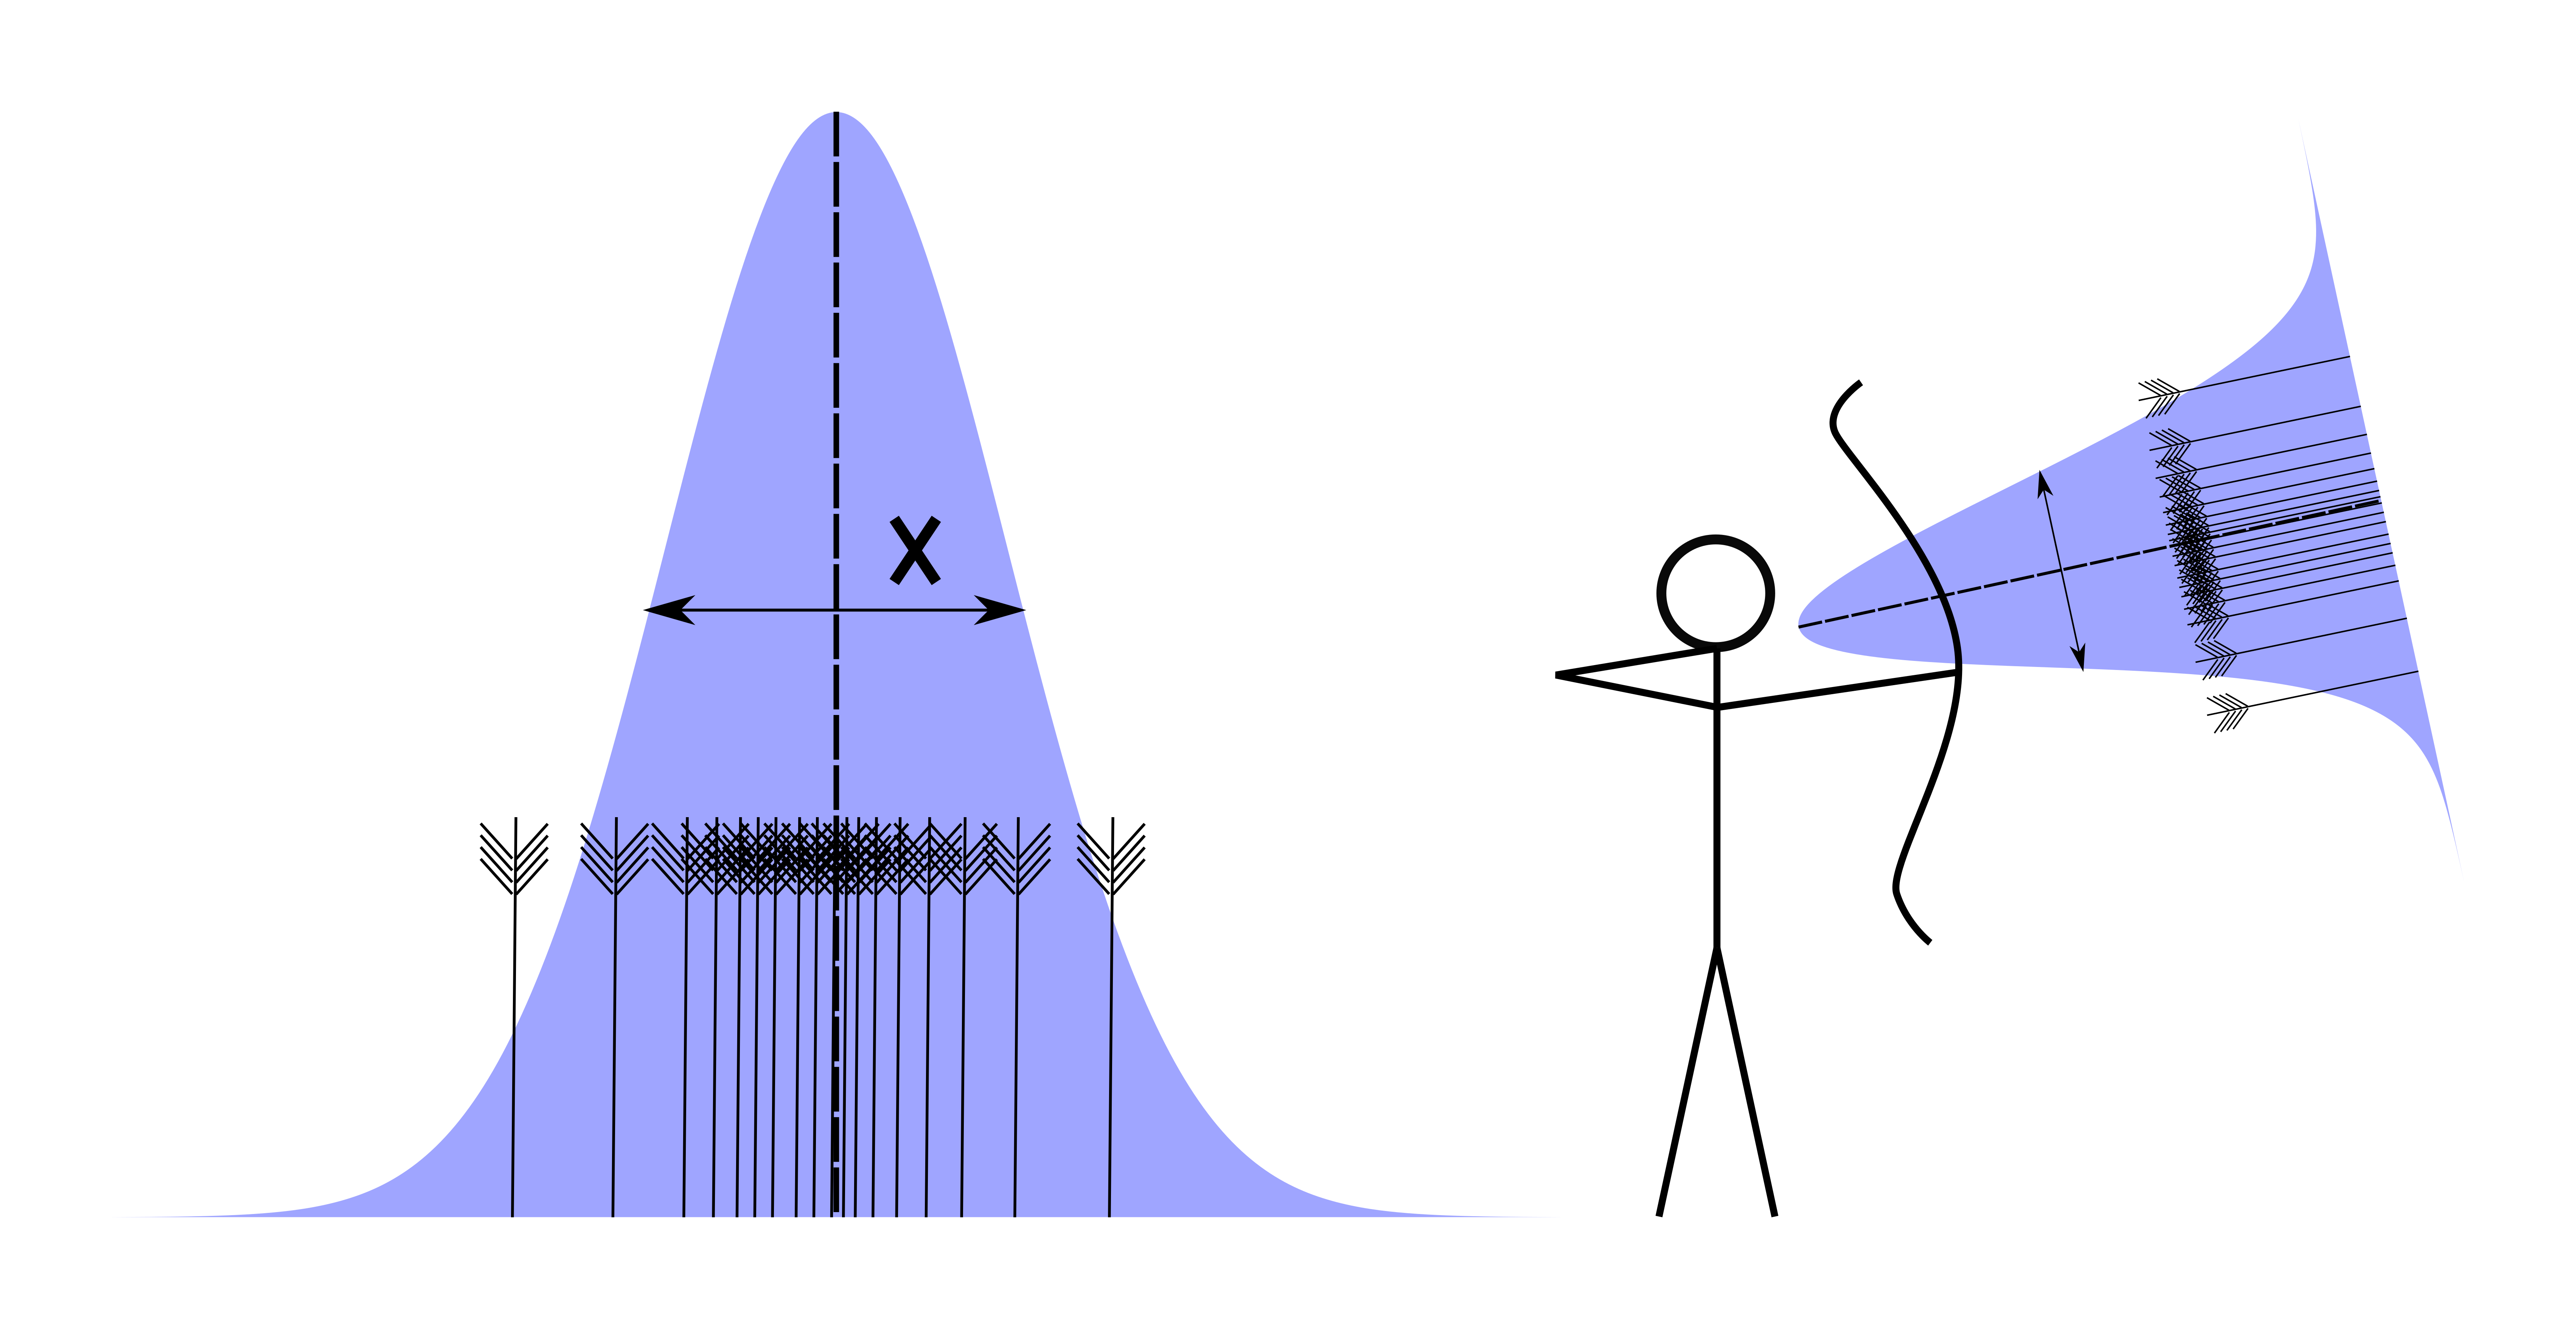
The imperfect archer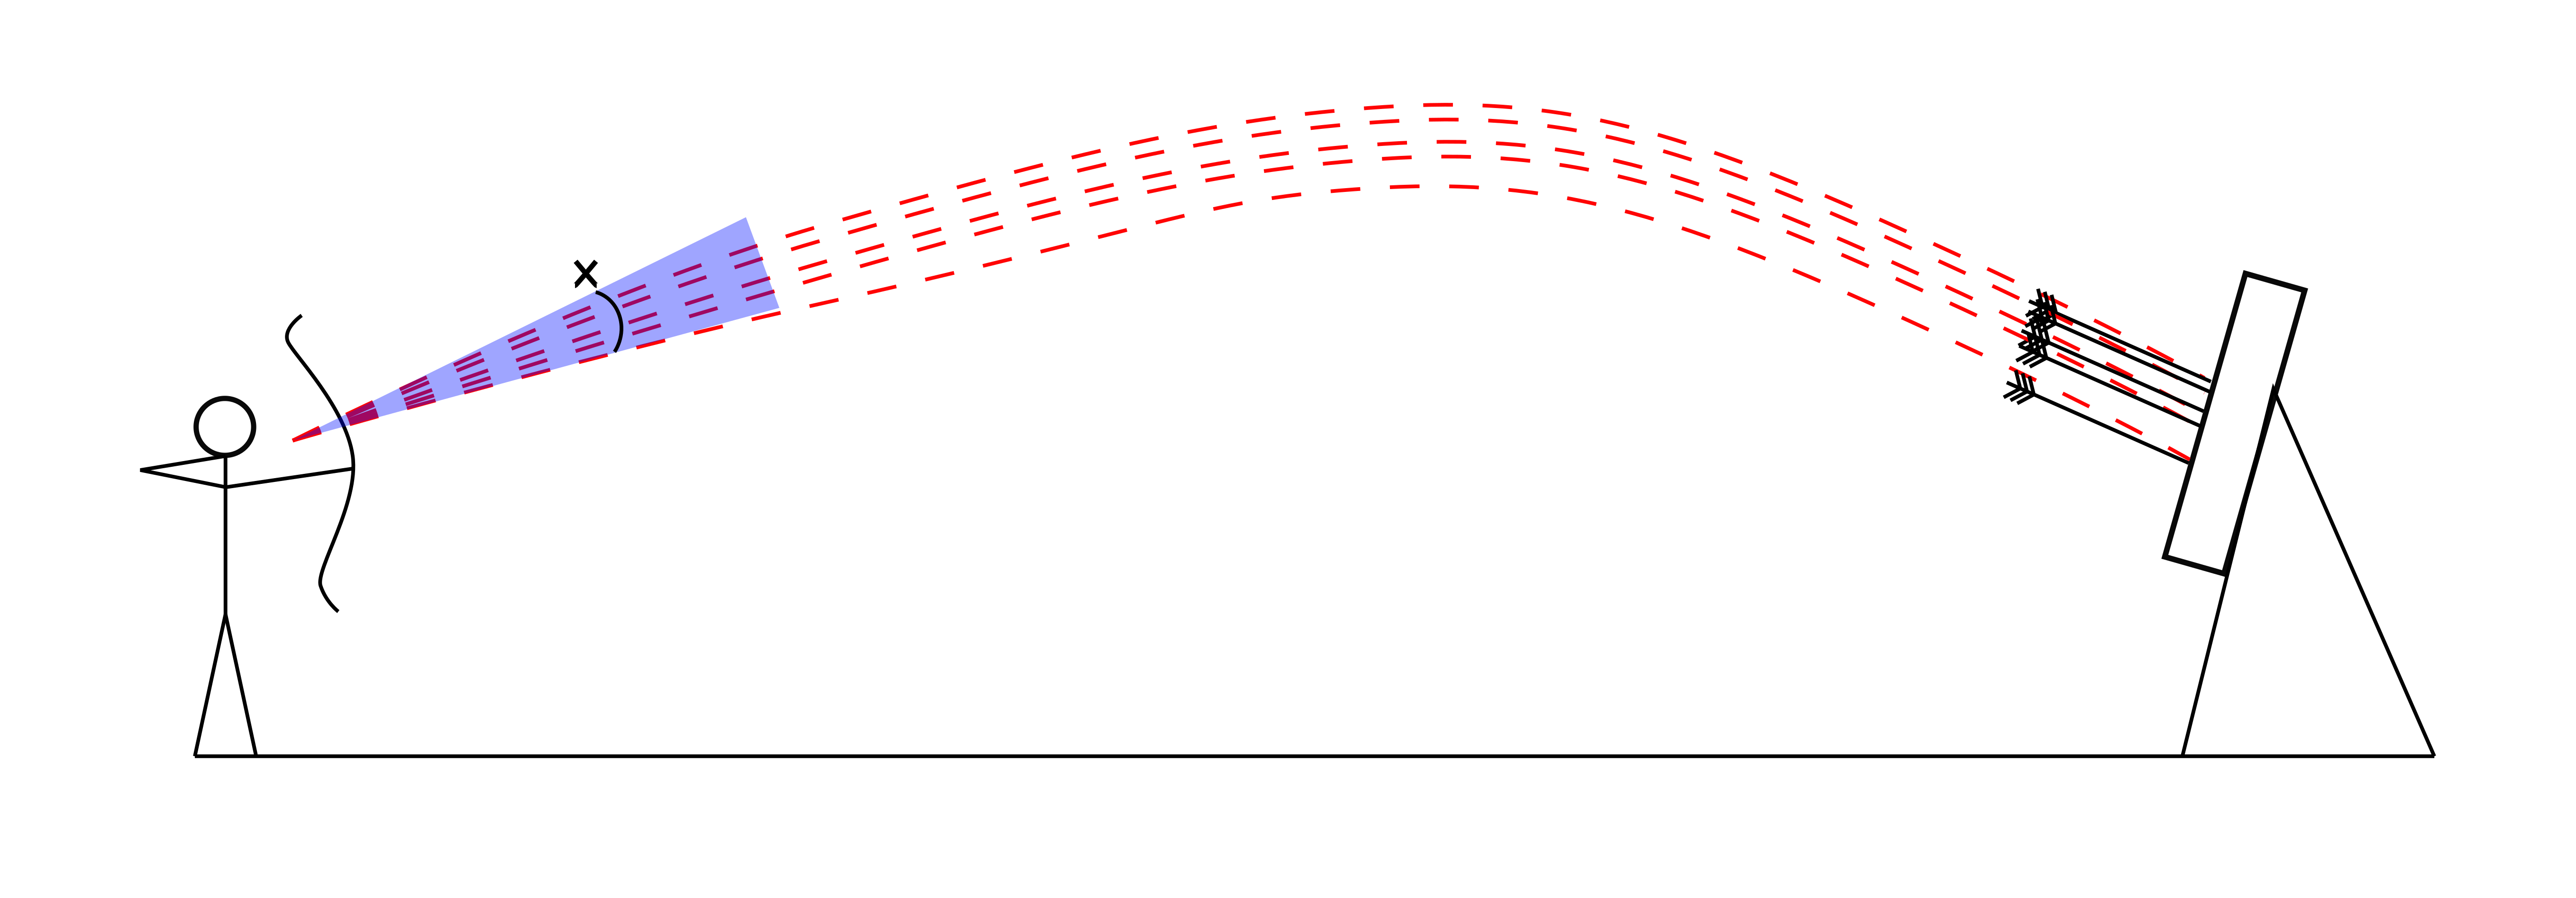
The spread of these arrows can be described by an angle that contains all of the trajectories at the point at which they leave the bow. This is shown by the blue triangle in the above image, with the angle labelled ‘x’. The smaller this angle, the tighter the group will be at the target. At the most fundamental level, this angle is the archer’s handicap.
In reality we shoot many arrows, all of which make a contribution to the final score. So far we have used only the widest two arrows to give us an indication of skill, but in reality we are interested in the spread of all of the arrows on the target. What we really need is some kind of average angle to describe all of the shots an archer has made. If we look at many shots plotted together we should find that they are concentrated around the centre of the target where we are trying to hit, with outliers becoming more and more sparse as we move away from the centre.
Typical distribution of arrows on the target.
This kind of pattern can be described by the well-known normal distribution . This is a plot that tells us the probability of finding an arrow in a particular location and is shown in the below image above a target face. The most likely location (the red peak on the distribution) is in the centre of the target, where we aim. Around this, where our group falls, the probability is still relatively large (yellow on the distribution). As we move further out, however, to where we only get the occasional stray arrow, the probability of our shots landing at these locations is small (the blue regions).

The normal distribution indicating the probability that an arrow will land at a certain point on a target face.
The thickness of the distribution is called the ‘standard deviation’. This is shown as the width ‘x’ on the diagram below. We now replace the previous image (using the angle between the widest shots) with a new one which uses a normal distribution to describe the archer’s shots.
Shots described by a normal distribution.
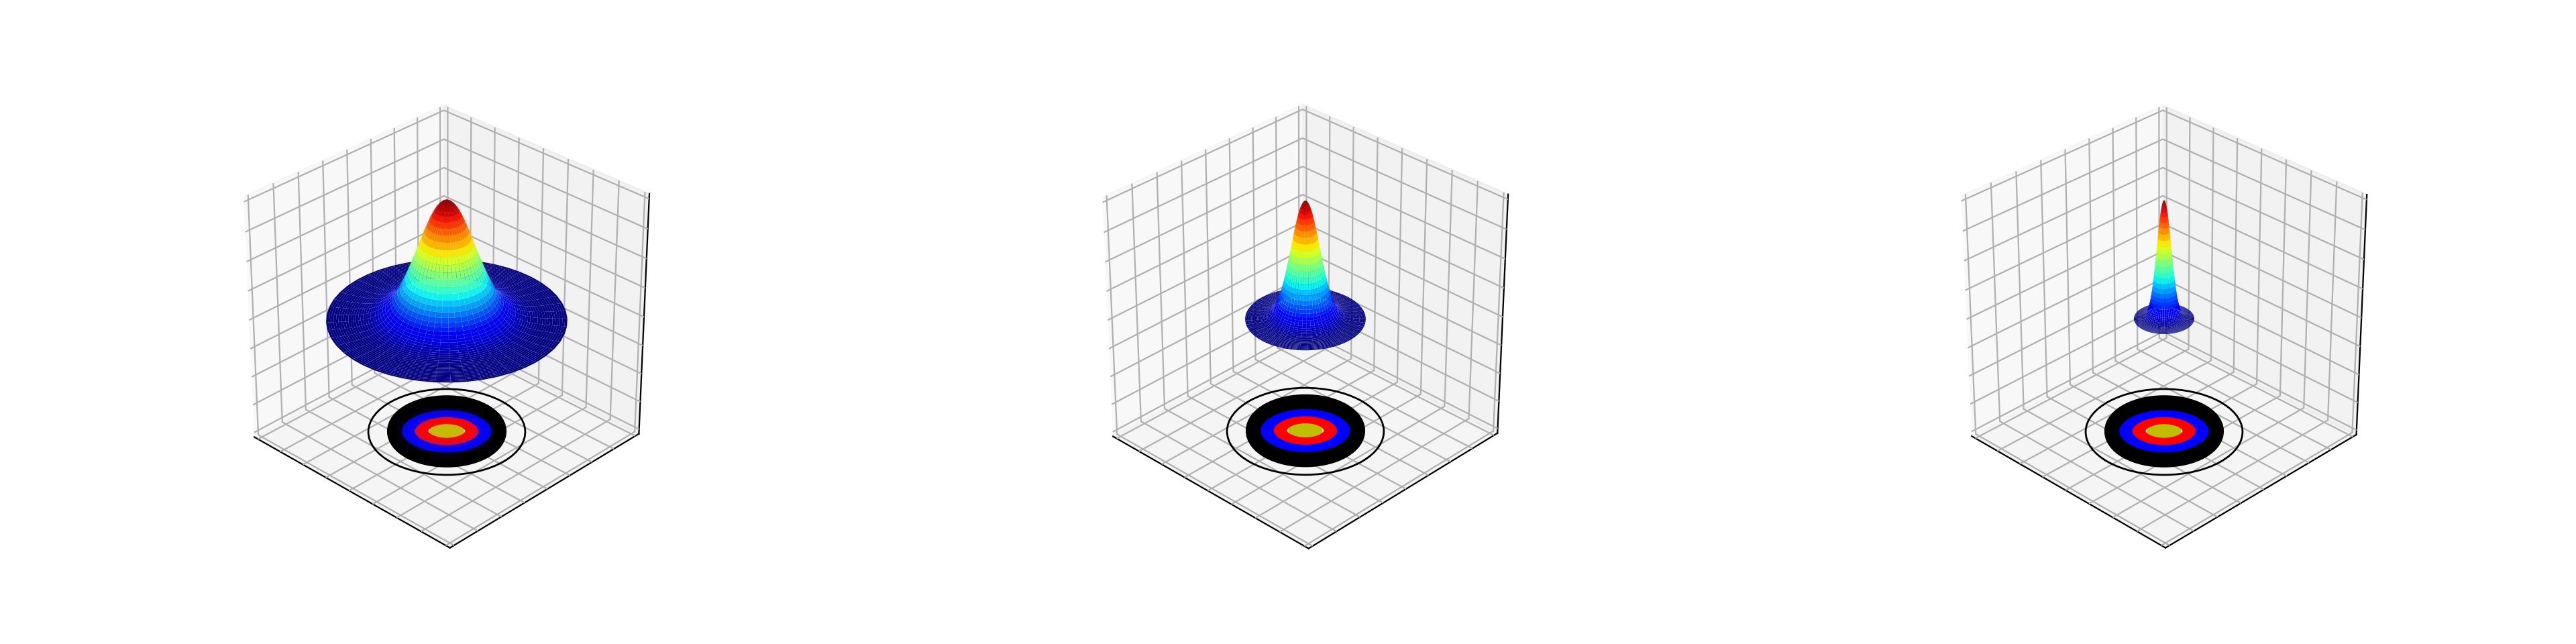
It is now the width (standard deviation) of this normal distribution that will be used to represent the archer’s handicap. The lower the handicap, the smaller the standard deviation. The image on the left below shows a high handicap archer who typically hits the target face, with the occasional miss. On the right is the distribution of a more skilled archer who groups in the gold, with the occasional arrow out into the red.
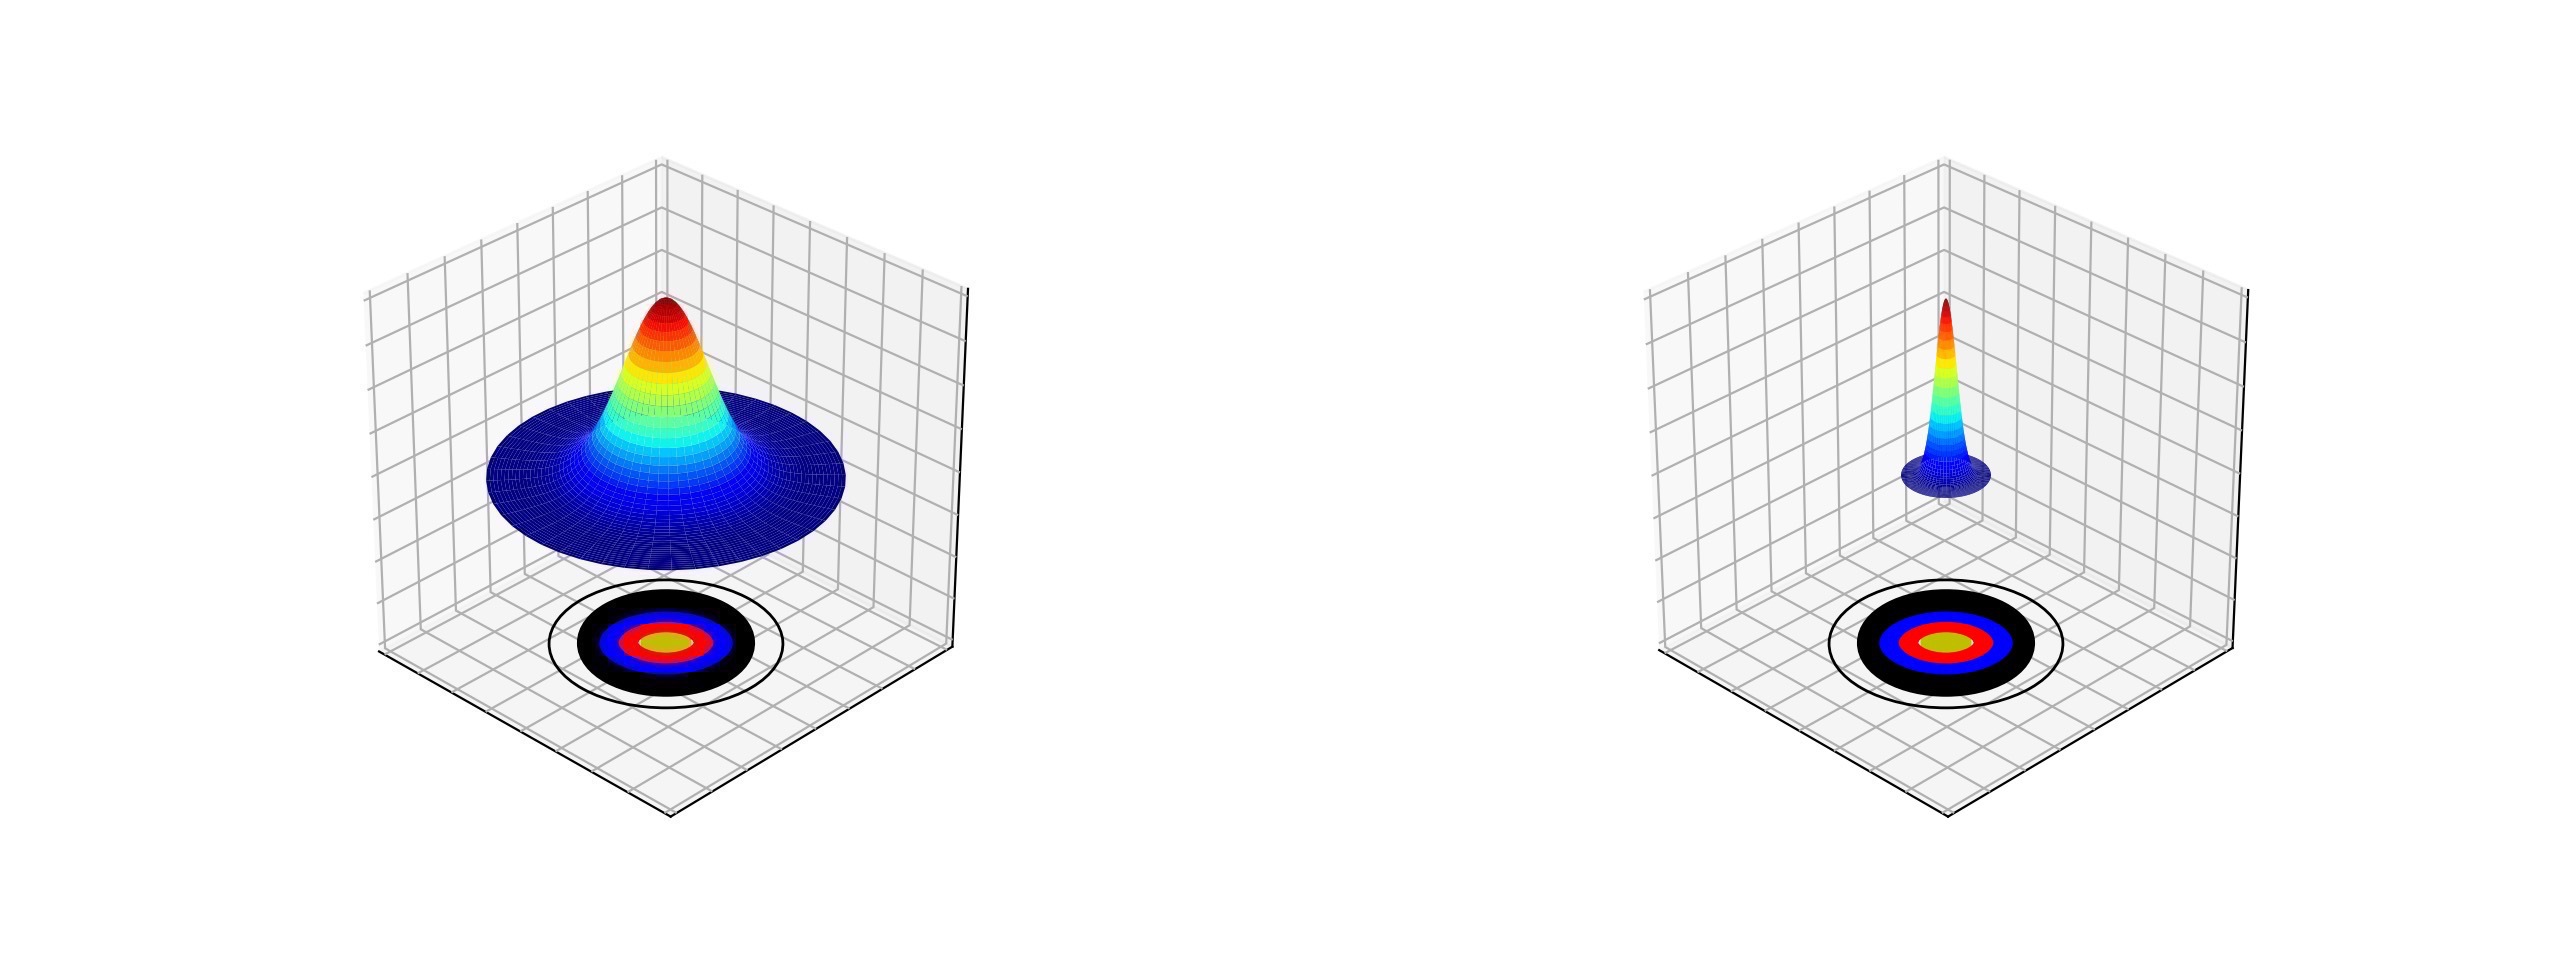
Arrow distributions of a high handicap (low skill) archer (left) and low handicap (high skill) archer.
So at its most simple level, your handicap tells you the standard deviation of the angle at which you shoot your arrows from the bow. This translates directly to the deviation/spread of arrows on the target, and your average group size. The scheme ranges from a handicap of 100, which is an angle of 1.55 degrees, to a handicap of 0 which is an angle of 0.045 degrees. For reference, an angle of 0.5 degrees would give a group the size of the boss at 70m and corresponds to a handicap of 68.
So now that we have an idea of what a handicap is, the last step is to work out what scores we would get on a a particular face, and a particular distance, for a certain number of arrows. First we shall deal with the distance.
If the arrows shot can be described by the angle x, then the diameter of the group on the target at a distance D will be x*D. Therefore if we double the distance, we also double the diameter of the group. This means that we can deal with different distances simply by multiplying our handicap angle by the distance we are shooting in order to get our group size at the target.
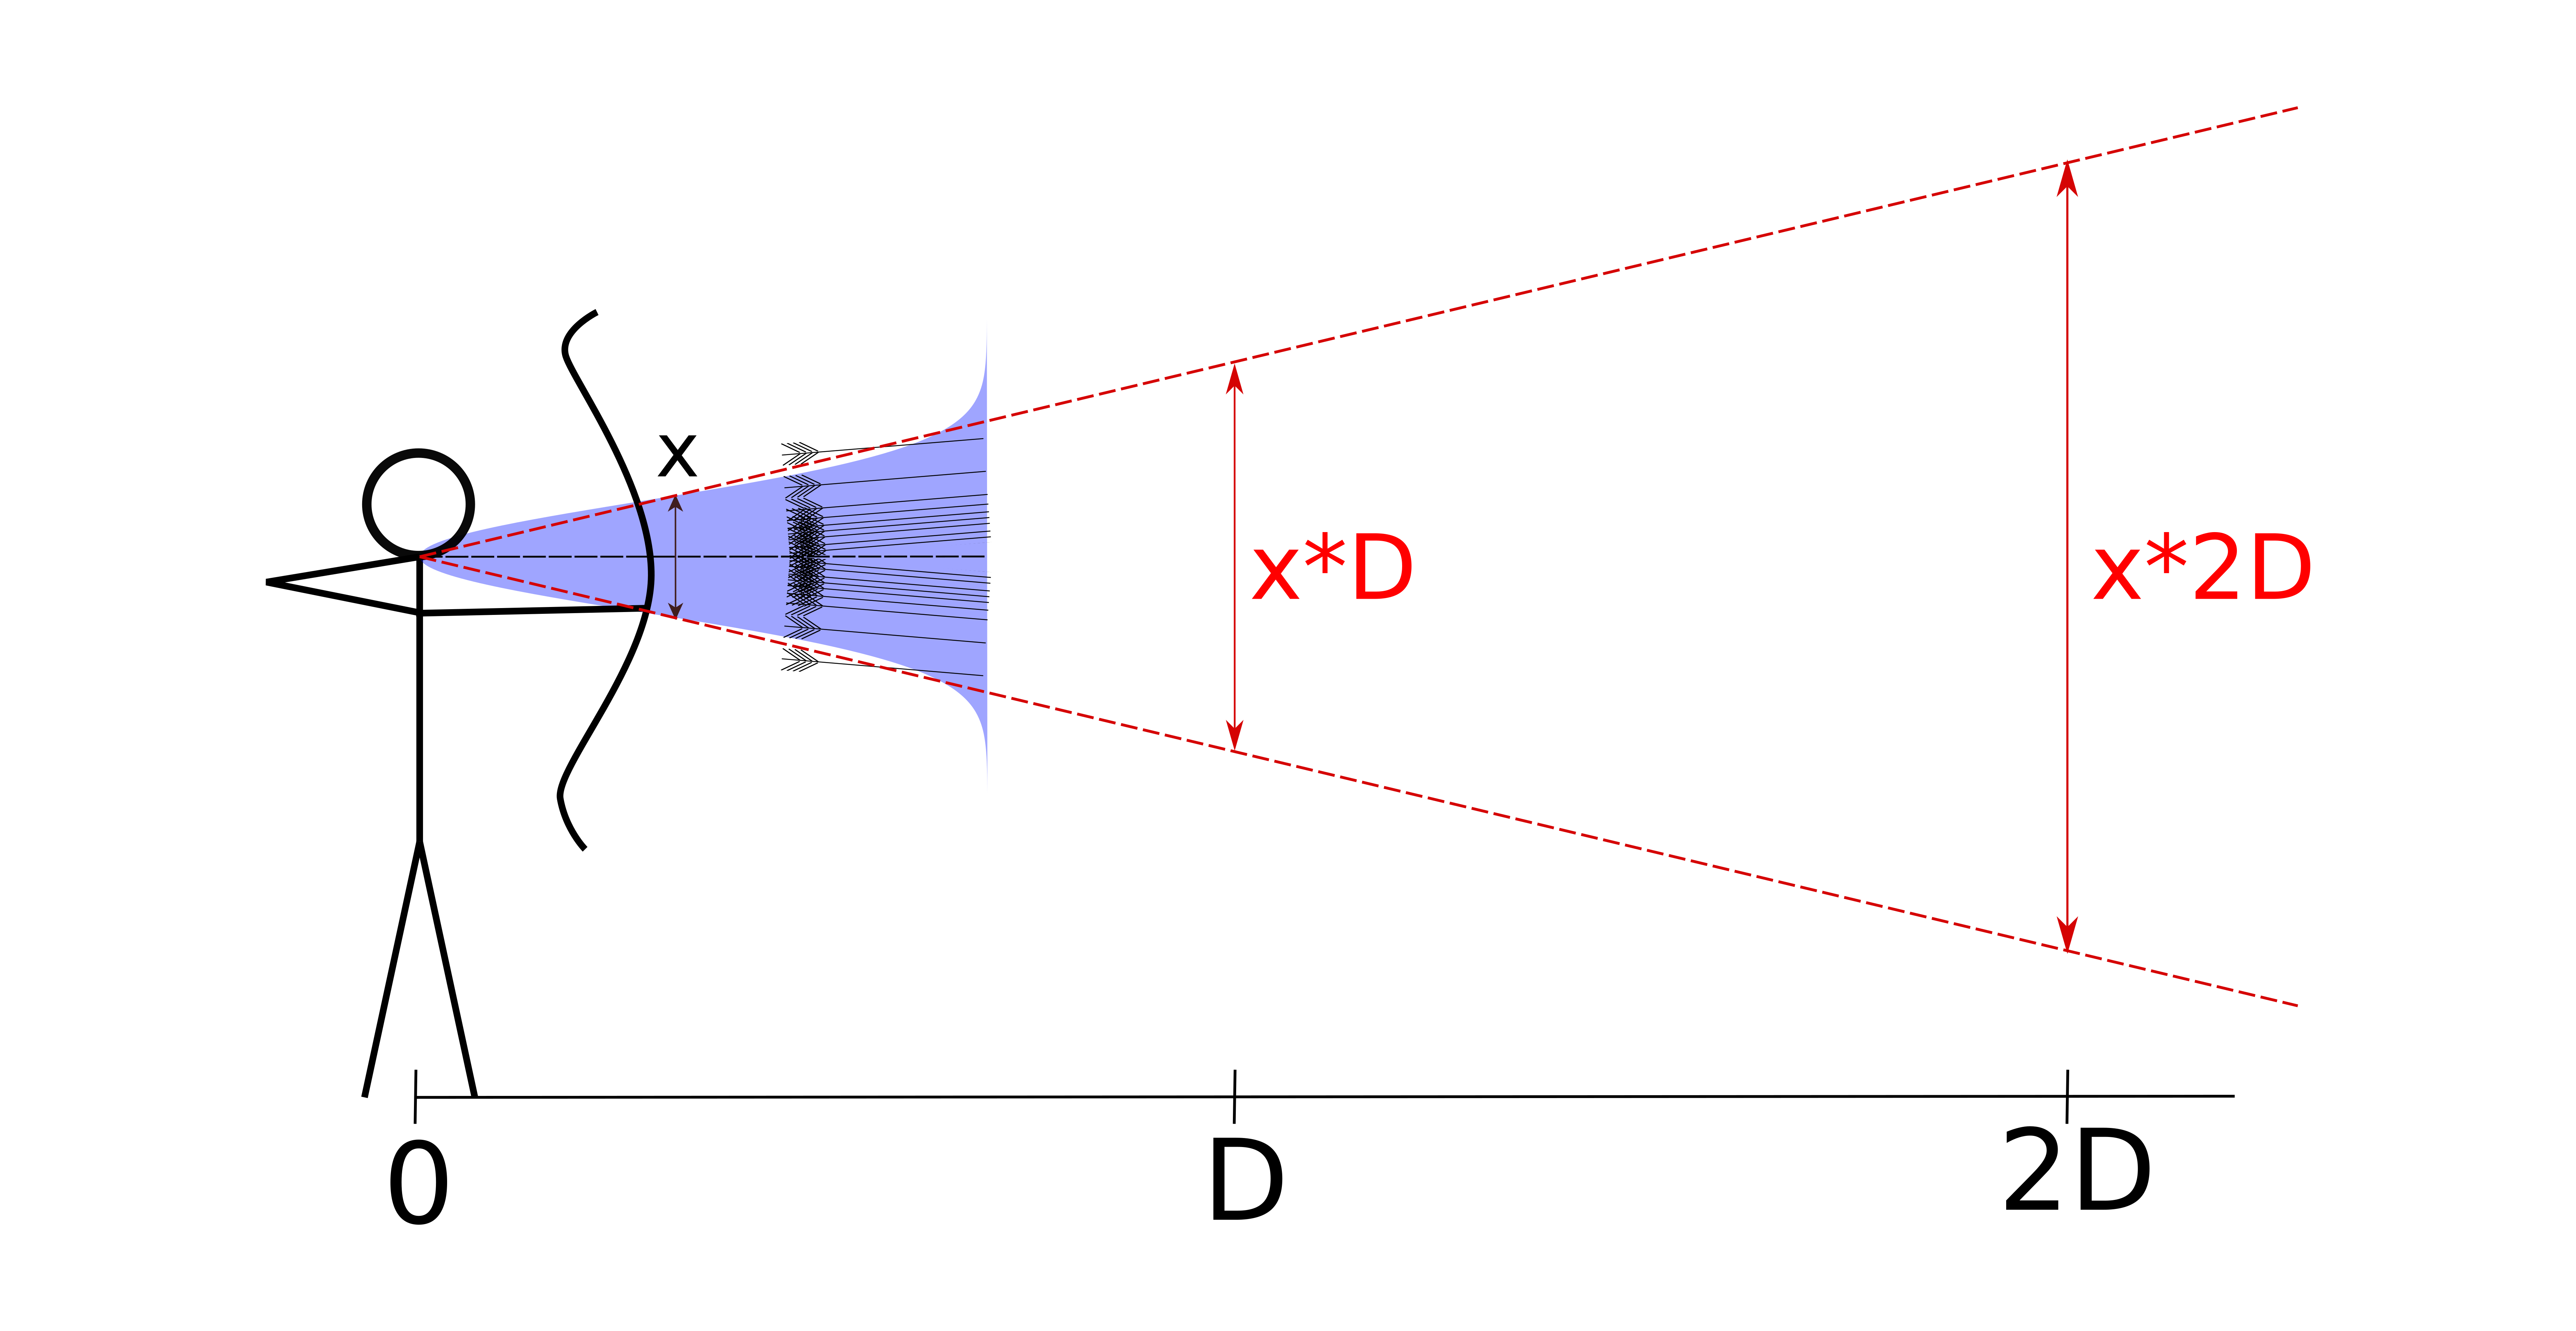
The effect of distance on group size.
The next stage is to work out what score we would get as a result of hitting a target face of a certain size with particular scoring zones. To do this we take a small diversion to a similar, but much more simple, problem; the average score from rolling a six-sided die. The average score can be calculated by multiplying each possible score (1-6) by the probability of rolling that score (1/6) and adding them up, as illustrated in the diagram below. This gives us an expected score of 3.5. Don’t believe this? Do the experiment yourself!

The average score for rolling a six-sided die.
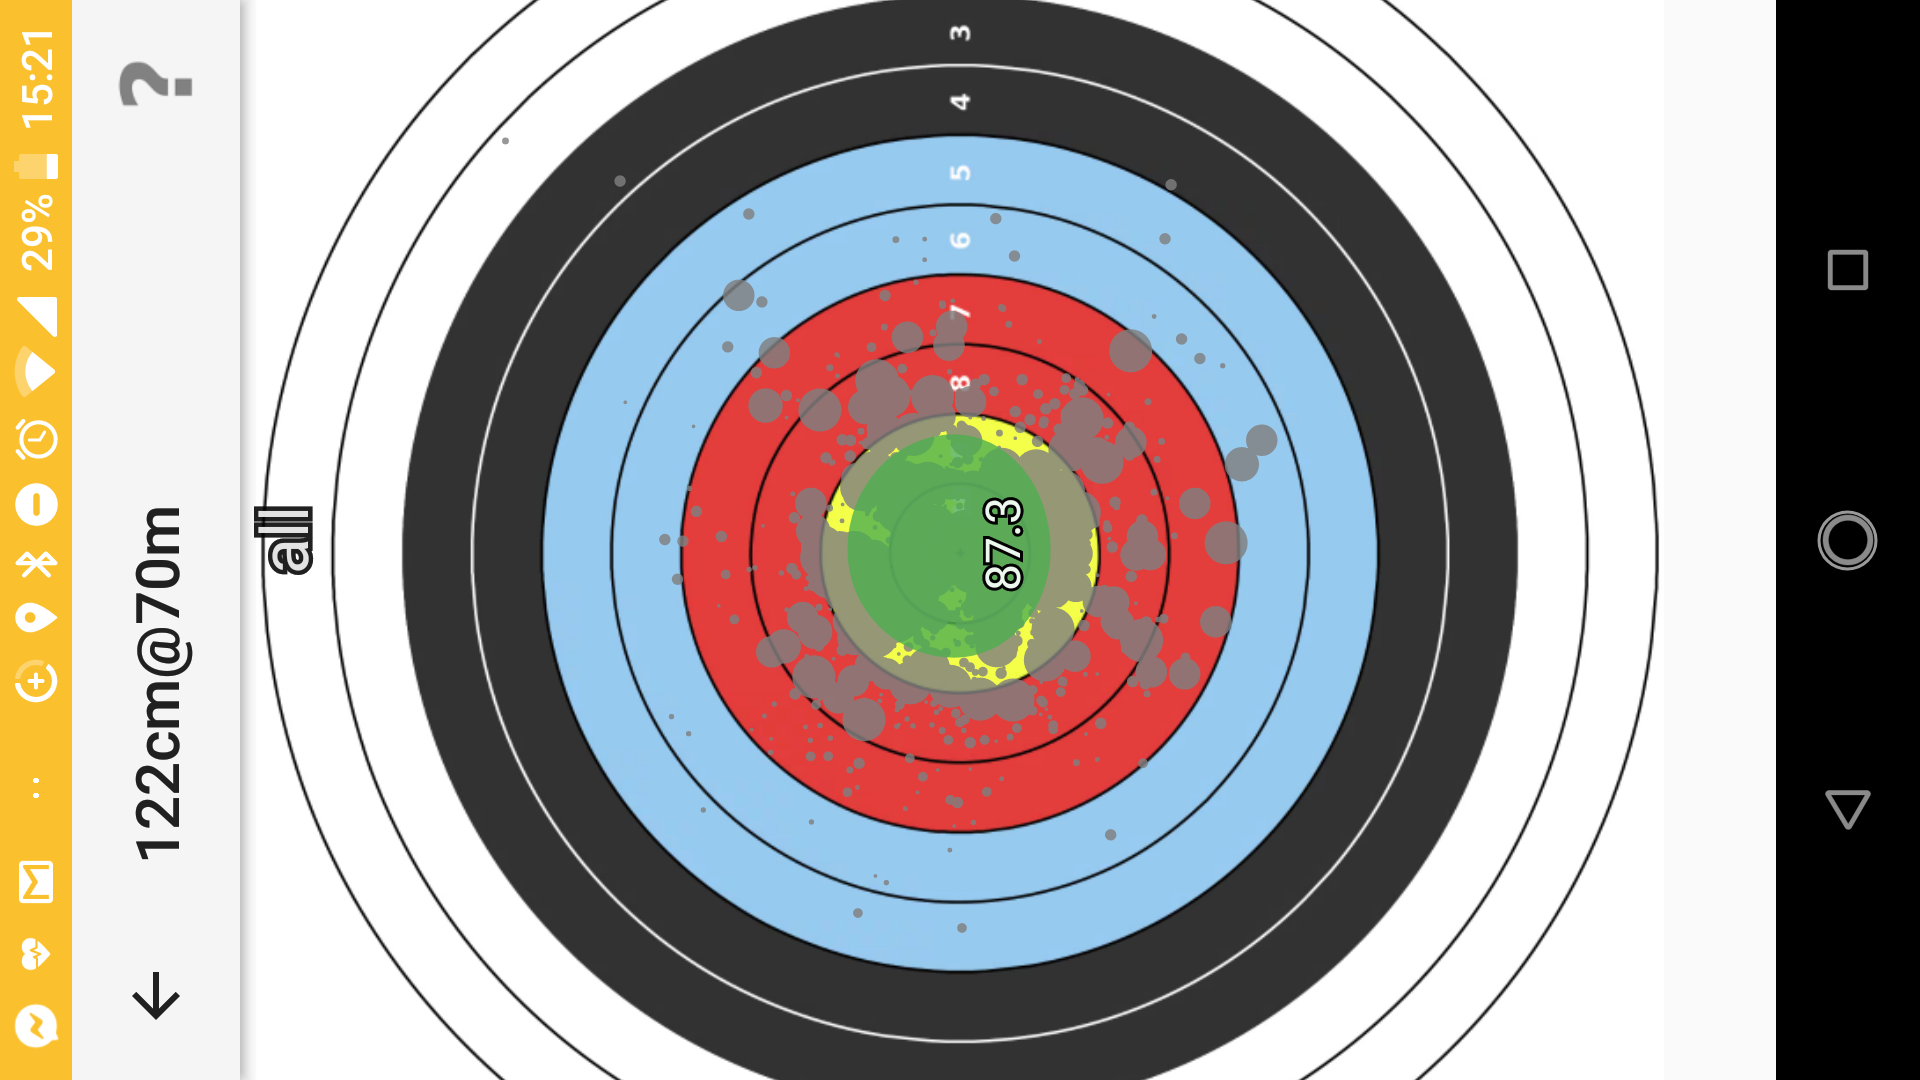
So how can we extend this analogy to our normal distribution of arrows on a target face? We start by representing the scoring zones as a series of steps that increase from 0 at the edge of the target to the maximum score at the centre. An example of this step representation is shown below for a 122cm face using imperial scoring. Of course, we could represent any type of circular target simply by changing the width and height of the steps. We then overlay this with our probability of where an arrow will land (the blue normal distribution). Then, just as we did for the die roll we multiply them together, the result of which is shown in the bottom graph. The final step is to add the results together (the blue area underneath the graph) to give us the expected average arrow score - about 6.8 in this case.
Target score step plot and arrow probability distribution (top) and the result of multiplying the two together (bottom).

We now just multiply this one arrow score by the number of arrows we shoot to get the total score for the end/dozen/round etc. If a round is made up of different distances and/or face sizes we repeat the entire process for each one, and then add the totals together. Using this approach we now have the power to calculate handicap scores for any kind of target at any distance!
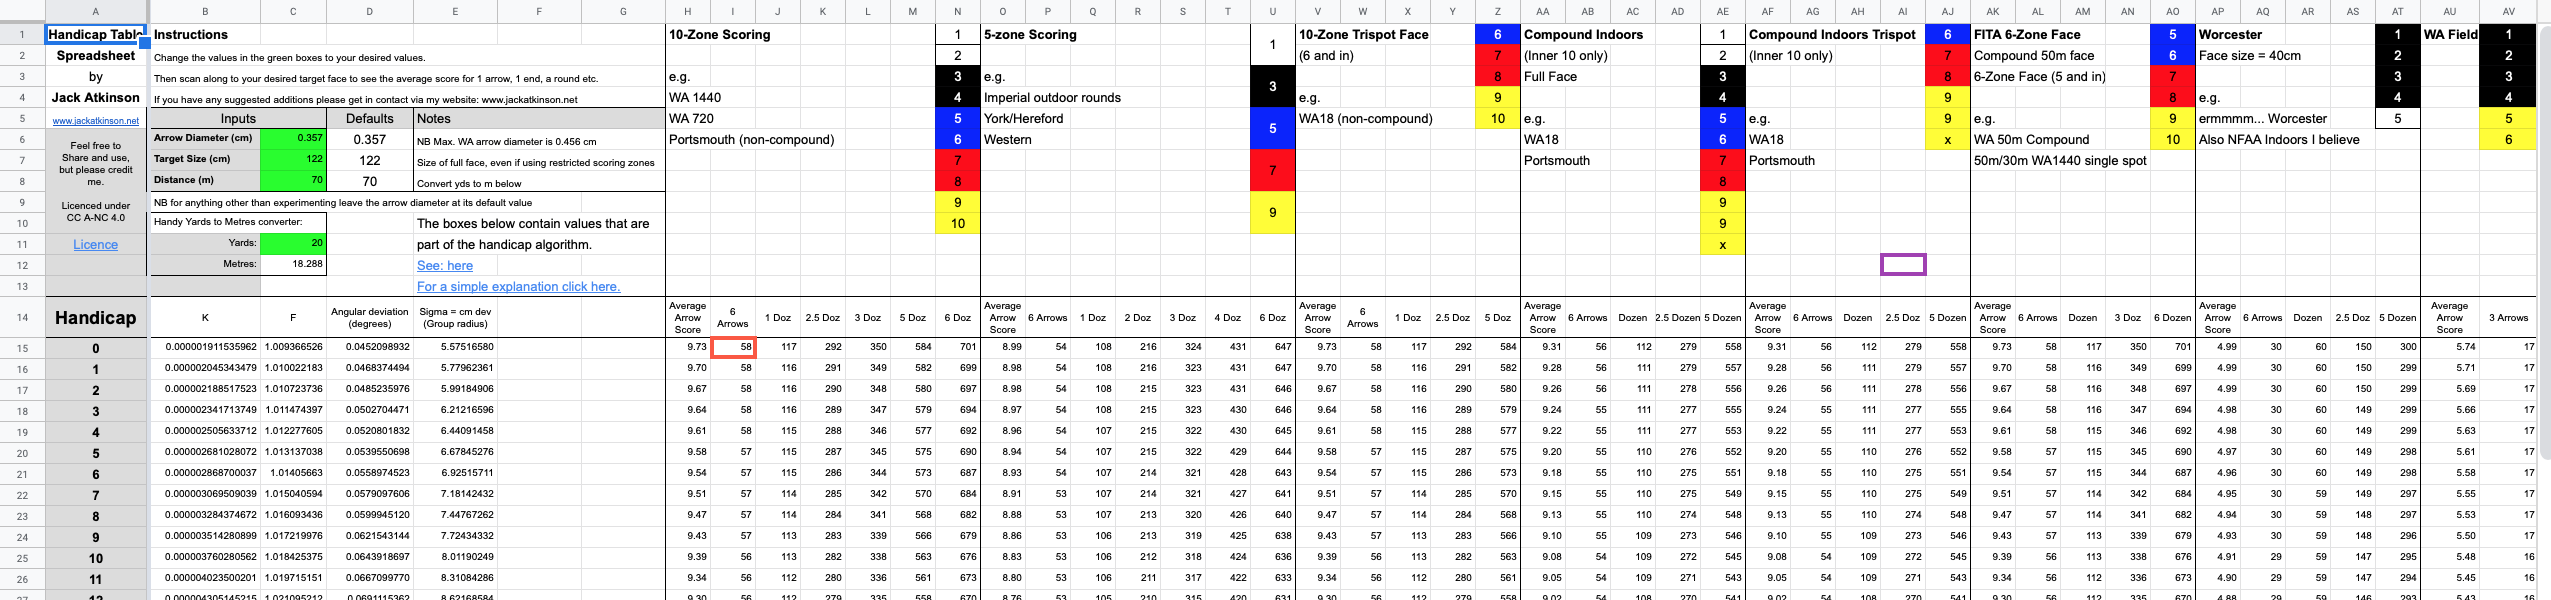
If this sounds daunting then you will be pleased to know I have put all of this into a spreadsheet where you can set the target size and distance to generate handicap tables for a variety of faces. These include indoor and outdoor rounds, compound and non-compound, and even the 6-zone WA faces that don’t currently feature on the official handicap tables. Ever wonder what the handicaps were for Beiter hit and miss…? Of course you didn’t, but that’s on there too! The spreadsheet can be found here , with a preview shown below.
I also maintain the website archerycalculator.co.uk that serves a similar functionality.
There are a couple of final points that are worth noting before we conclude this explanation.
The first is the step size between handicaps. An increase of one handicap point represents an increase in accuracy of (i.e. group size shrinks by) 3.6%. This is why the lower handicaps see large changes in score, whilst the top levels may require only one or two points to move up a step.
The second point I wish to address is that, whilst the mathematics has been somewhat hand-wavy, this is on purpose. The intention of this article is to give the average layarcher an understanding of where handicaps come from, what they mean, and how they can be used. If you fancy a more in-depth, mathematical understanding, please do read David’s papers and my future articles on this subject. Linked to this, I should add that there are a few further details/corrections involved with generating the final handicap tables, but these are really just bells and whistles on what I have described above.
Uses
Now that we have a better appreciation of what handicaps mean I will briefly outline some of their many uses.
The first is the ability to compare rounds. We have seen how it is possible to construct scores for any combinations of face size or distance, and put these together to form a round. By using the tables to calculate your handicap score for a particular round you can compare it to your handicap from an entirely different round and see how they compare in absolute terms. For example, your scores on a WA 1440 and a Western will be wildly different, but your handicaps should (hopefully) be the same, or similar.
Another use is to track progress. Though you can use PBs or classifications or [Insert favourite badge scheme here] to chart your progress through the word of archery, the steps between these tend to be quite large and can take a while to achieve. The rungs on the handicap ladder are much closer together, and there are many more of them. This way you can keep seeing progress, even if you haven’t got any new badges recently.
Following on from this handicaps can also be used to evaluate technique changes. When you make a change to your shooting style scores inevitably drop off for a while. By regularly tracking the handicap of anything you score in practice you can see how much of an effect technique changes have, how quickly you recover/learn, and if your new style allows you to surpass your previous scores.
Another excellent way in which handicaps can be useful is highlighting areas for improvement. Do you have a favourite distance/target to shoot that you feel is just right for you? If you shoot a round across different distances you can calculate a handicap for each one and see how they compare to one another (NB archerycalculator.co.uk can be used to do this). Find out if your favourite distance really is your best! If you have any distances/faces that are a noticeably lower handicap then this may be an area you need to spend more time practising. I find this particularly useful for field where there are a wide variety of face sizes.
Alternatively, if your handicap drops off at close or long range, this may be indicative of equipment or tuning issues. A poor handicap at long distances might suggest arrows are parachuting and you need skinnier arrows/fletchings, whilst at close distance it might indicate clearance issues. These are, of course, just two examples.
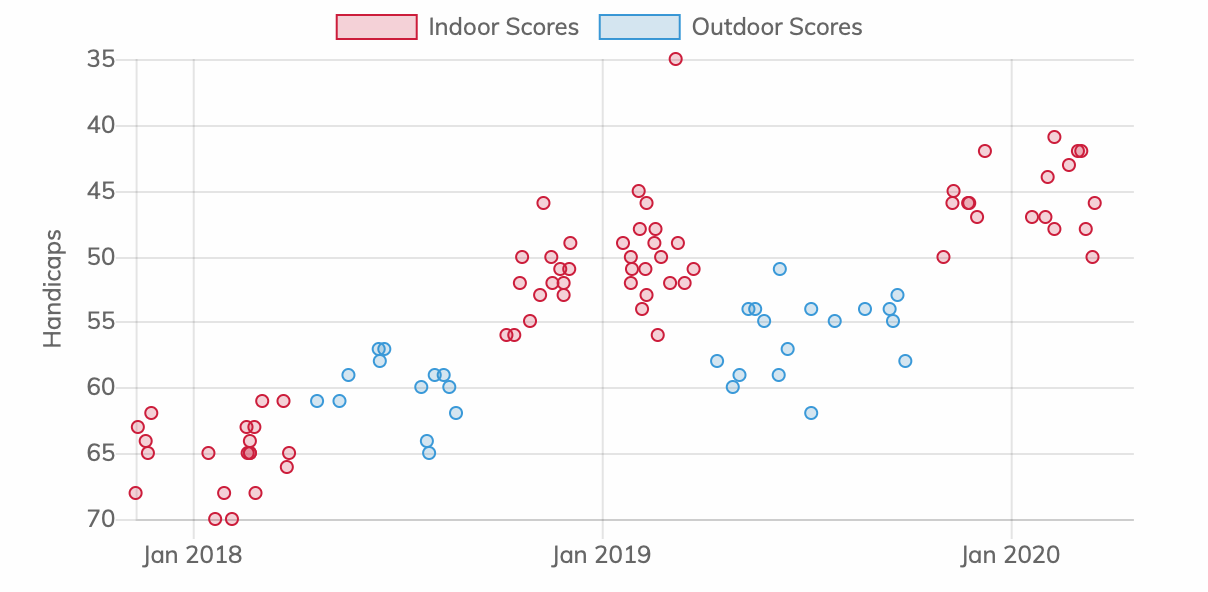
Tracking handicaps in archr.
A Brief Critique
Like any mathematical model, the handicap scheme is a useful tool, but it is not perfect. It is worth evaluating what it is good for and where its weaknesses lie.
The first big assumption is that archers have reasonable technique, with arrows shot following a normal distribution. However, often we find that our misses fall in a particular direction e.g. from dropping our bow arm, poor release, or bow arm reaction. As a result we are no longer shooting in the way the model expects, and our average performance/group size might actually be better than our handicap suggests. The scoring app artemis deals with this to an extent by providing a 2D (bivariate) normal distribution.
Artemis’ ‘skill level’ can be used in a similar way to handicaps and will track any arrows scored.
Another important aspect is the effect of distance and different bow types. Though arrows follow a straight line to the target at close ranges, at long distances they travel in an arc tracing out a path that is longer than the direct distance to the target. They will continue to spread out along this distance, so really it is the arrow path length rather than target distance we should be using when we calculate group size at the target (x*D above). The distance of this arc will be different for everyone, however, depending on bow speed (i.e. poundage and bowstyle), arrow weight etc. Though the handicap algorithms attempt to deal with this (see the K-factor) it is by no means perfect. Just think about how different the trajectory of a longbow is to that of a compound!
Another interesting observation from the model is the fact that imperial rounds with 5-zone scoring are punishing. If you put all 6 arrows in the 10 ring at 90 m, the handicap for a 1440 will reward you for doing this. If you do it at 100 yd on a York, however, the handicap has no idea that this is any different to a group that fills the gold [The author is in no way bitter about this happening to him last summer] but if you drop an arrow a hairsbreadth into the red this is no different to a wide 7. This, and the longer flight path at further distances, are reasons why archers find it more difficult to get classification scores on a York/Hereford compared to a 1440. Similarly this is why an archer’s handicaps for the WA 720 rounds tend to be a bit higher than those on a 1440.
Finally a particular vendetta of mine is handicap shoots. These are often the only use people know of for the handicap scheme (though I hope you now know of many better ones) and it is claimed that they allow everyone to ‘compete on a level footing whatever their ability’. This is a myth, however. As we have seen, each handicap point represents a constant improvement of 3.6%. Therefore an archer who improves from a handicap of 61 to 60 will do so by scoring many more points than one who improves from 18 to 16 on the same round, despite the fact that the latter has shown a larger improvement in a relative sense. A much better approach would be to award medals at a handicap shoot based on many handicap points an archer improves by on the day rather than the current approach of adding an allowance to theoretically bring everyone to 1440. I encourage anyone reading this to bring this up next time your club/county suggests running a handicap shoot!
Despite these criticisms/observations the handicap tables still provide a rating by which we can compare scores and rounds. Even though there are flaws with the model compared to reality, they do not significantly impact the many uses I outlined above. I hope that you now have a better understanding of the handicap system and how it works, and can make use of it to improve your shooting.
References
archerycalculator.co.uk handicap calculator
David Lane’s work on the handicap tables is summarised in the following articles:
- The Construction of Handicap Tables for Archers, Lane, D. Letter to GNAS (1978)
- Handicap Tables, Lane, D. Toxophilus 2(1) (1979)
- The variation of accuracy with range, Lane, D. Toxophilus 2(3) (1979)
- The construction of the graduated handicap tables for target archery, Lane, D. Publicly available article (2013) - PDF
Please contact me if you would like a copy of any of these.